Dependencies and The Decision-Making Sequence
What is wrong with this management agreement?
Original: “The managing agency shall be paid 8% of gross revenues each month on or before the 25th.”
(Here is a hint: Look at the re-worded agreement, clarifying understanding and remove any ambiguity.)
Revised: “The managing agency shall be paid 8% of the preceding month’s gross revenues each month on or before the 25th.”
There are two activities implied in each of these two statements. (1) One month’s gross revenues shall be totaled. (2) Eight percent of the total shall be calculated and paid.
A dependency diagram would make this clear. Calculating a (prior) month’s gross income comes first, and calculation of a management fee is a dependency, but it is not simply a dependency in time!
Most people assume that dependency diagrams are flow charts or time sequence charts. They are NOT!.
Dependency Diagrams are best described as knowledge and product dependency Diagrams
Transient Products
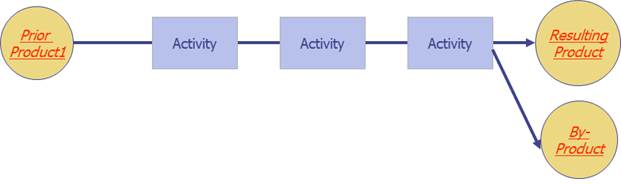
Each process activity box in a dependency diagram could be drawn on a separate page. A resulting product could be shown for each process step, and that product could be shown as the key ingredient, or incoming product, to a subsequent step.
Instead, these transient products are typically not shown, unless a deeper level of detail is really required to understand the work. Process steps are connected one to the next, and these transient products are implied in the diagram.
In the management agreement example, the calculation of gross revenues produces a product: a dollar sum. That transient product (the dollar sum) is the input to the calculation of a percent management fee.
If a transient product is flawed, all subsequent process steps are voided!
The dependency diagram for calculating management fees reminds us that a correct percentage calculation depends on a correct sum of the previous monthly revenue. If prior months revenue calculations are incorrect, all downstream calculations are null and void.!
It is an understandable mistake to think that dependency diagrams show time sequence, but the deeper interpretation is that a bookkeeper must know the monthly revenue sum before a correct management fee can be calculated. It is in this sense that dependencies illustrate knowledge dependencies.
Dependencies In Project Management
Dependency diagrams are a essential tool in process management, but the concept of knowledge dependencies may be clearer if we draw a couple of examples from the other branch of tactical management: Project Management.
Knowledge dependencies may be clearer if we take a look at PERT chart techniques in project task scheduling.
In a systematic scheduling of tasks, task relationships are typically described as predecessor and successor tasks. Tasks are related in one of four ways: Finish-Start (FS), Start-Start (SS), Start-Finish (SF), and Finish-Finish (FF). In addition, a gap or overlap is specified as lead or lag time.
Novice schedulers just “know” that Task A (Build Forms) should happen on Monday and Tuesday, and Task B (Pour Concrete) should follow on Wednesday and Thursday.
If they use a software package, they fiddle with task dependencies and leads and lags until the two tasks appear on the calendar where they intended. This is not how these powerful tools were meant to be used.
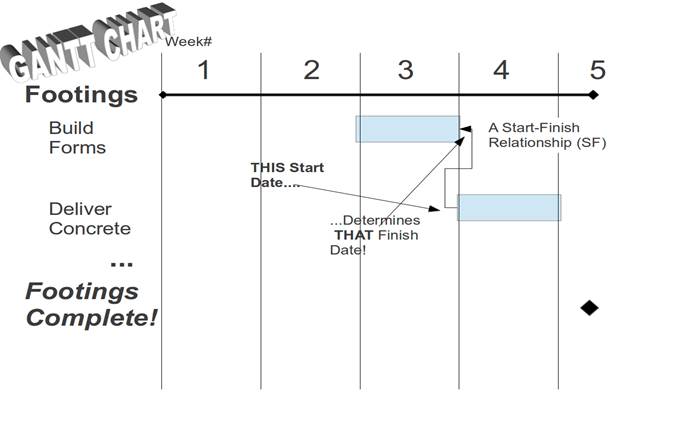
The concrete contractors, let us say, are our most difficult to schedule workers. They have promised to bring concrete to our work site on Wednesday. That is the predecessor task. It is a bit of certainty that the rest of the schedule builds on.
Based on the knowledge that the concrete will be delivered on Wednesday, we establish a relationship with the successor task. We calculate that the building of forms to hold wet concrete must be finished before concrete is delivered on Wednesday. That is a Start-Finish relationship.
Since construction of footings is expected to be a two-day process, we determine a starting date for that task by the powerful mathematical technique known as subtraction. We work backwards on the calendar to find the Monday starting date of Task A.
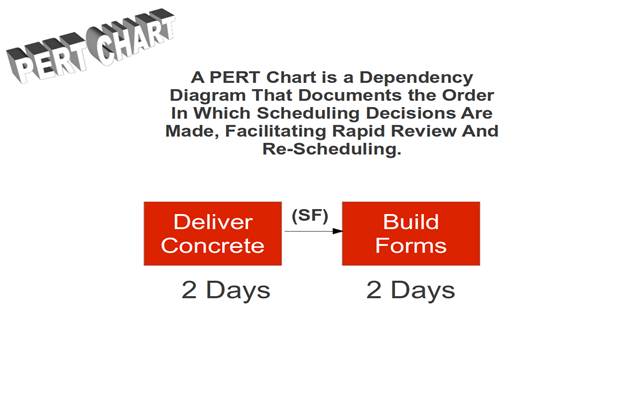
The Gantt chart shows the time sequence: A precedes B. But the PERT chart preserves the knowledge dependency relationship.
On the PERT chart view, Task B (Concrete) comes first, and Task A (Forms) follows. This is because we know with some degree of certainty when concrete will be delivered, and we are planning the other tasks accordingly.
We plan because there will be change. Things will not always go according to plan. If the concrete contractors reschedule, the PERT chart and the Start-Finish dependencies in our scheduling plan remind us which tasks must be rescheduled.
In process and project management, the tactical manager’s “go-to”move is re-deployment of resources in order to accommodate change, substitute equipment and methods, and in some cases – shorten the duration of resource-driven tasks.
The dependency diagram retains a record of causality in our decision-making. “Why did we schedule form construction when we did? Because the concrete contractors go on the schedule first, and other tasks are scheduled and rescheduled accordingly.”
Critical Path
Dependencies are used sparingly in project scheduling to represent real constraints. In our example, the difficulty of scheduling concrete had an impact on at least one other task.
A prepared bed for concrete complete with forms is something that may be perishable. Perhaps we do not want that work completed and left exposed to the elements for too long before concrete is delivered. There is a definite reason to incorporate this dependency in scheduling.
Other tasks are scheduled later by analyzing available resources. The limitation of workers and equipment keeps us from tackling every task simultaneously, and a project manager will work that out in a second phase of scheduling.
For now, these tasks that are independent are left on the schedule to start ASAP (as soon as possible). Resource limitations will cause some of these to be delayed.
At this early stage of scheduling, something called a critical path emerges. It is possible to identify a sequence of tasks that determine the minimum total duration of a project.
If there are no dependencies in a project and everything is scheduled ASAP, the critical path is simply the time it takes to complete the longest task.
When product and knowledge dependencies are identified and incorporated into the schedule, a realistic timeline of the project begins to take shape.
Novice misuse of scheduling software and dependency-based scheduling often results in everything being linked into a too long critical path. This creates unrealistically long estimates of the total project duration and leads the manager to think their only means of improvement is more resources.
Proper and sparing use of dependencies and ASAP scheduling gives the tactical manager options. They can choose where and when to deploy and redeploy resources. They can lengthen non-critical tasks and shorten tasks on the critical path.
When things change, when things do not go according to plan, the most powerful tool in the tactical manager’s kit is the power to redeploy resources. A good plan establishes contingencies in advance.
The Factor Table
Dependency diagrams are not flow charts. Particularly in process management, they represent a planning of work that proceeds from certainty to certainty, from correct product to correct product.
How, then, can such a simple method for diagramming processes be made flexible enough to accommodate variability and unknowns?
Many are tempted to turn dependency diagrams into flow charts. They want to introduce decision box symbols and branching and looping lines and arrows. This is not only unnecessary; it is a mistake that will have a negative impact on the ability of a tactical team to work confidently, correctly, and consistently.
In another article, we apply dependency diagramming to work in call centers. In that call center example, our process is to greet, identify the caller, and then match the call request. Callers can call about a multitude of things.
Even if we factor the types of calls into a smaller and manageable number, how then does the manager maintain a sense of orderly correctness with a simple dependency diagram? If we decree that there are a dozen different types of calls, do we make a dozen dependency diagrams to plan and describe each process variant?
The answer is no, and the solution is something called factor tables. A discussion of factor tables deserves its own article in this series. Once mastered, you will never be tempted to turn dependency diagrams into flow charts.
© Operation Improvement Inc 2025. All rights reserved.
Got Two Minutes?