Inspiration…How the Walkabout Approach Evolved.
How We "Learn. Share. Teach. Improve."
— Operation Improvement Inc (@oiBusServices) February 14, 2026
Read The Article Here: https://t.co/xkoUr7lOwY pic.twitter.com/cGpamtmCYF
“With your team, Spot the Opportunities.”
ONE:
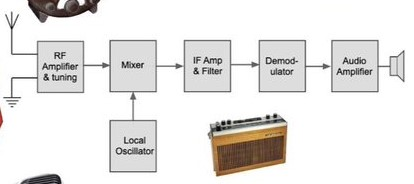
This classic “Block Diagram” is used to understand and verify correct signal processing. The end of each block is a test point. A broadcast signal could be detected and verified for quality.
Problem diagnosis/root cause analysis is accelerated with this approach. For example, we could start in the middle! If the radio signal is missing or distorted after the “IF amp”, further downstream diagnosis is unnecessary. Any problems with this system would be found upstream.
(Credit to:@ElecNotes at x.com)
Years ago, this exact diagram inspired me to apply this analysis technique to process engineering. (The first version we created was in a latex dip and mold plant.) Working together with James Abbott (@CallCtrScience at x.com), we added product symbols and it looked like this:
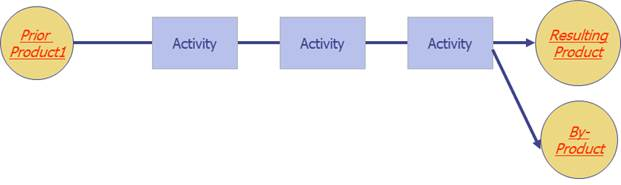
In the plant, we used this mnemonic: “Products” in the diagram are round (like biscuits) and are Nouns. “Activities” are square (like ovens) and are verbs. We first used these diagrams to go “Walkabout” around the manufacturing operation to get an entire process summarized on a single page.
TWO:
The next improvement integrated this diagram with process test points, analogous to the test points in an electrical circuit. In process management terminology – these are Metrics and their corresponding Measures of both process and the incoming and final products.
We found it helpful to use simple examples, like this one, to train others in the technique. Production Walkabouts also rapidly became filled with proprietary information – another reason for our sample diagrams. Actual dependency diagrams from one client could not be used in another business without redaction.
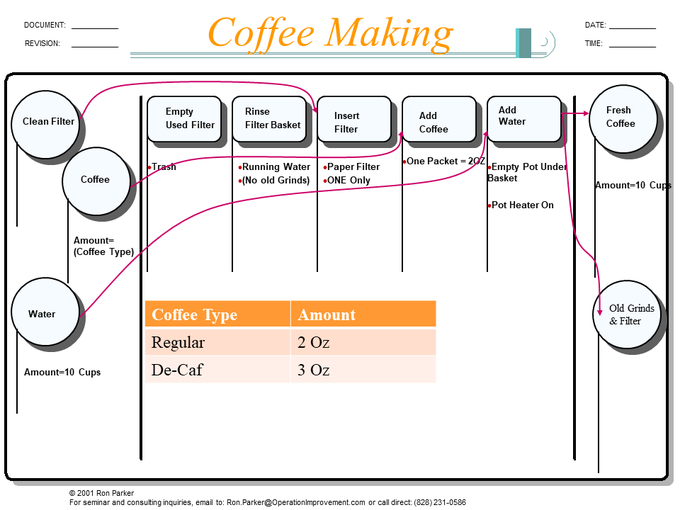
“Factor Tables” or “Decision Tables” eliminated decision boxes, by parameterizing the diagram. One master diagram describes an entire product family! (This improvement to the Walkabout diagram was developed in a plant that produced hydraulic valves to customer specifications.)
THREE:
Integrating Process Control and Sigma Capability Analysis Was an easy next step, since the approach identified all potential Metrics and their relationships. (The “Walkabout” integration of -correlated- process/product metrics, process control and product capability analysis was developed in a couple of plants that manufactured electric motors.)
Activities are monitored for consistency (or “stability”) and to verify that they are holding to a correct target (average) value. A change in these charts could indicate a product improvement, a degradation, or in batch production – the end of a manufacturing lot.
Products are monitored for conformity to targets and tolerances, but most importantly, the process is assessed for its future capability to produce the desired product!
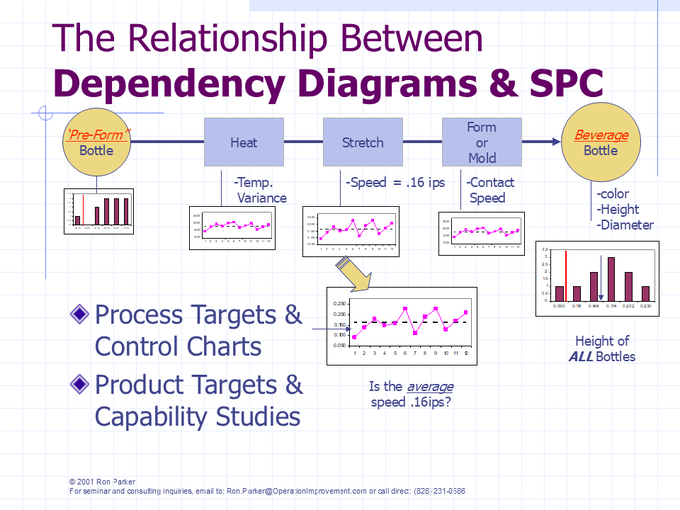
It is an important distinction that a Sigma/Product Capability Analysis is -not- simply a description of past and present product produced.
Capability is a statement of the -ability-, or potential, of a process to produce to desired specifications at a given rate of production, when operated correctly and consistently.
It is the difference between “I have bench-pressed 200 lbs.” versus “I am able to bench-press 200 lbs.”
FOUR:
We have applied this approach to managing a “correct” and “consistent” process in manufacturing and service industries. It scales to simplify the most complex processes, like this service example:
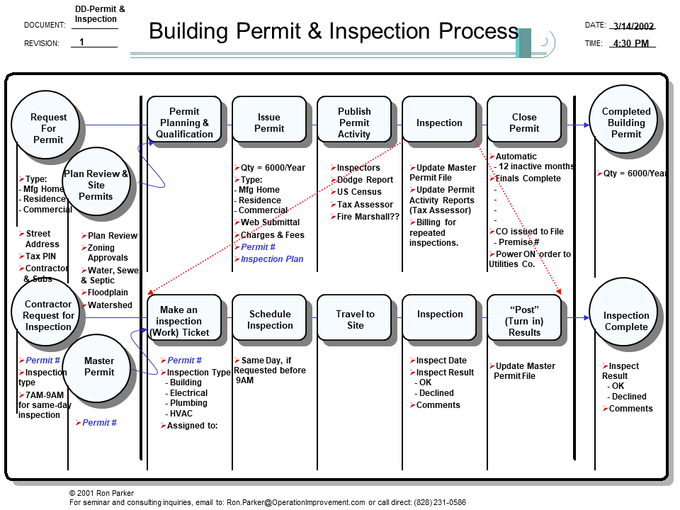
(We first began to apply Walkabouts to service processes in ‘Tech Support’ Call Centers, and later in the insurance and travel industries.) Any activity can be recursively analyzed on a separate sheet to any necessary level of detail.
FIVE:
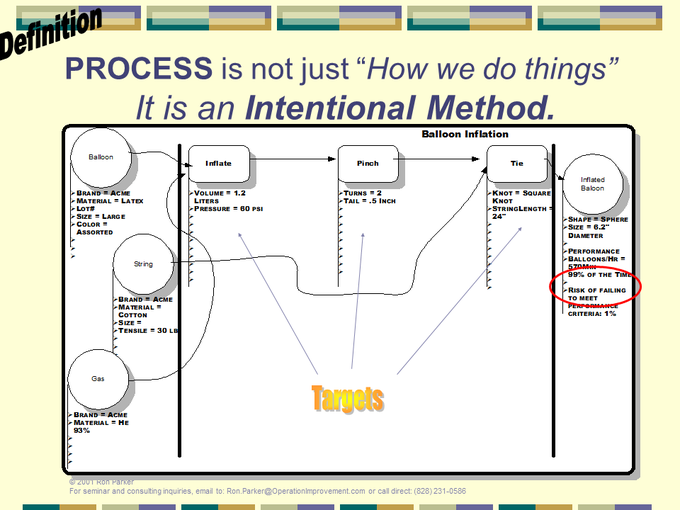
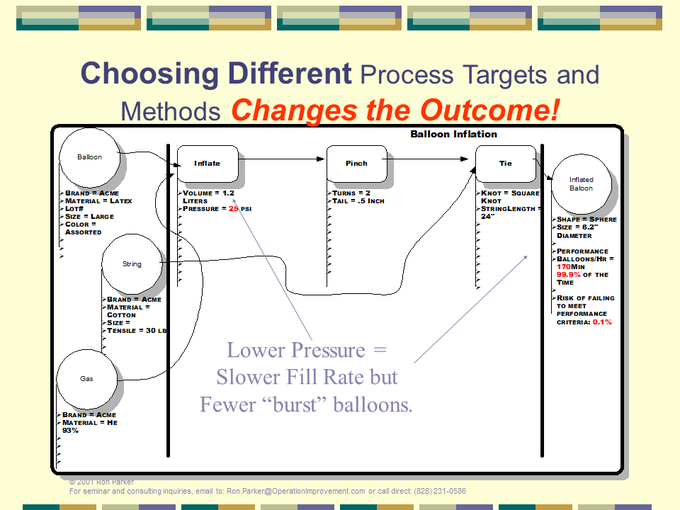
Finally, it facilitates integration of new process knowledge and its impact on capability. These are two slides from Walkabout training:
This documents a lower inflation pressure results in less scrap with a slower production rate as a tradeoff.
CONCLUSION:
Getting started with the Walkabout method is harder than it looks. This is not just a time sequence of events. Walkabouts describe knowledge dependencies! (Think about how these diagrams help as a diagnostic tool for electronic circuits!) Don’t be surprised if your first attempt is a page full of disconnected circles and squares!
It’s hard to make things easy, but we value organized process knowledge that empowers associates to THINK about cause-effect relationships, instead of simply being reduced to SOP OBEDIENCE.
The Walkabout method is a crucial part of our approach to continuous learning and management of a Correct, Consistent and Capable Operation.
When we learn something and can apply it – customer satisfaction improves. When we forget…
Got Two Minutes?