Archive
Inspiration…How the Walkabout Approach Evolved.
How We "Learn. Share. Teach. Improve."
— Operation Improvement Inc (@oiBusServices) February 14, 2026
Read The Article Here: https://t.co/xkoUr7lOwY pic.twitter.com/cGpamtmCYF
“With your team, Spot the Opportunities.”
ONE:
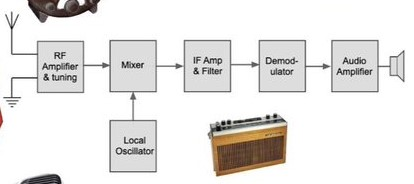
This classic “Block Diagram” is used to understand and verify correct signal processing. The end of each block is a test point. A broadcast signal could be detected and verified for quality.
Problem diagnosis/root cause analysis is accelerated with this approach. For example, we could start in the middle! If the radio signal is missing or distorted after the “IF amp”, further downstream diagnosis is unnecessary. Any problems with this system would be found upstream.
(Credit to:@ElecNotes at x.com)
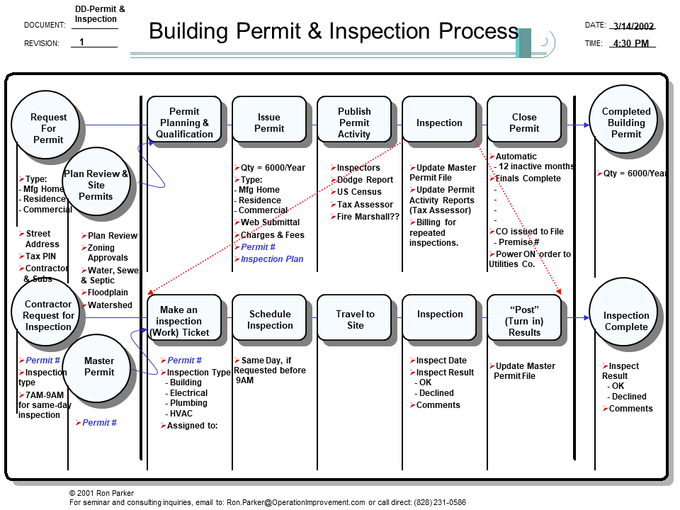
Years ago, this exact diagram inspired me to apply this analysis technique to process engineering. (The first version we created was in a latex dip and mold plant.) Working together with James Abbott (@CallCtrScience at x.com), we added product symbols and it looked like this:
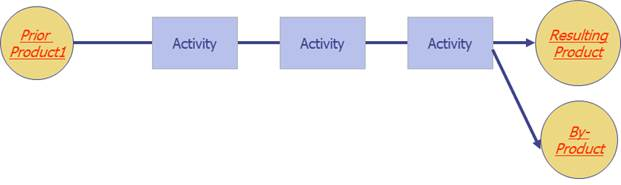
In the plant, we used this mnemonic: “Products” in the diagram are round (like biscuits) and are Nouns. “Activities” are square (like ovens) and are verbs. We first used these diagrams to go “Walkabout” around the manufacturing operation to get an entire process summarized on a single page.
TWO:
The next improvement integrated this diagram with process test points, analogous to the test points in an electrical circuit. In process management terminology – these are Metrics and their corresponding Measures of both process and the incoming and final products.
We found it helpful to use simple examples, like this one, to train others in the technique. Production Walkabouts also rapidly became filled with proprietary information – another reason for our sample diagrams. Actual dependency diagrams from one client could not be used in another business without redaction.
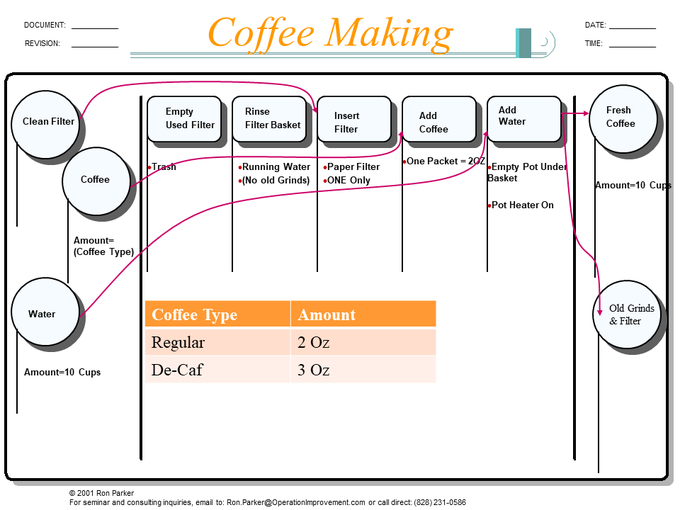
“Factor Tables” or “Decision Tables” eliminated decision boxes, by parameterizing the diagram. One master diagram describes an entire product family! (This improvement to the Walkabout diagram was developed in a plant that produced hydraulic valves to customer specifications.)
THREE:
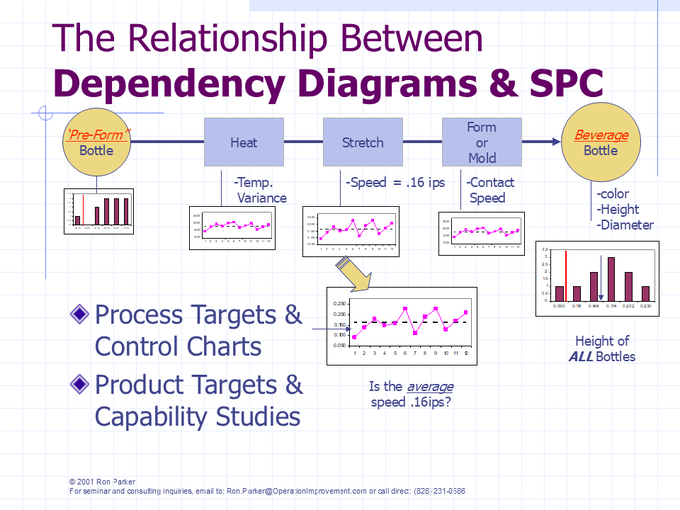
Integrating Process Control and Sigma Capability Analysis Was an easy next step, since the approach identified all potential Metrics and their relationships. (The “Walkabout” integration of -correlated- process/product metrics, process control and product capability analysis was developed in a couple of plants that manufactured electric motors.)
Activities are monitored for consistency (or “stability”) and to verify that they are holding to a correct target (average) value. A change in these charts could indicate a product improvement, a degradation, or in batch production – the end of a manufacturing lot.
Products are monitored for conformity to targets and tolerances, but most importantly, the process is assessed for its future capability to produce the desired product!
It is an important distinction that a Sigma/Product Capability Analysis is -not- simply a description of past and present product produced.
Capability is a statement of the -ability-, or potential, of a process to produce to desired specifications at a given rate of production, when operated correctly and consistently.
It is the difference between “I have bench-pressed 200 lbs.” versus “I am able to bench-press 200 lbs.”
FOUR:
We have applied this approach to managing a “correct” and “consistent” process in manufacturing and service industries. It scales to simplify the most complex processes, like this service example:
(We first began to apply Walkabouts to service processes in ‘Tech Support’ Call Centers, and later in the insurance and travel industries.) Any activity can be recursively analyzed on a separate sheet to any necessary level of detail.
FIVE:
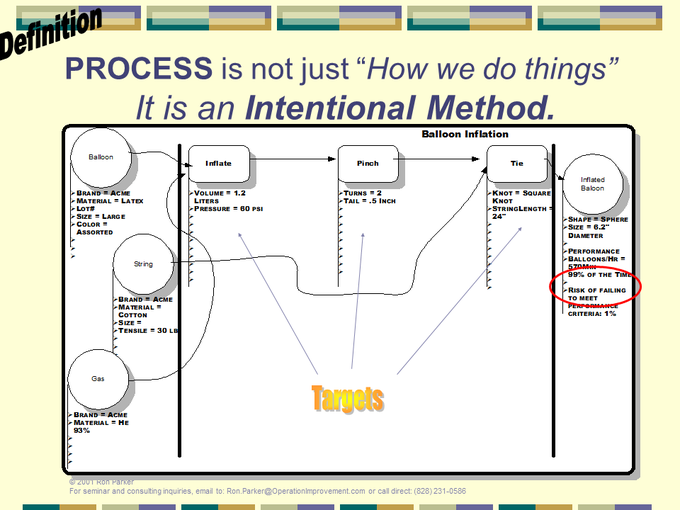
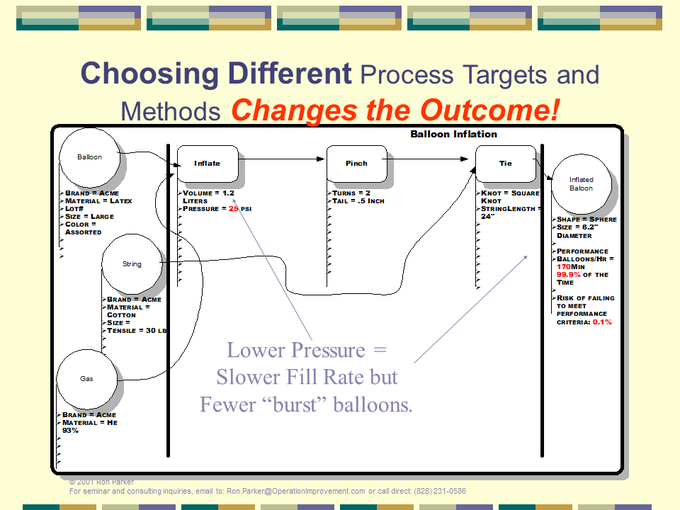
Finally, it facilitates integration of new process knowledge and its impact on capability. These are two slides from Walkabout training:
This documents a lower inflation pressure results in less scrap with a slower production rate as a tradeoff.
CONCLUSION:
Getting started with the Walkabout method is harder than it looks. This is not just a time sequence of events. Walkabouts describe knowledge dependencies! (Think about how these diagrams help as a diagnostic tool for electronic circuits!) Don’t be surprised if your first attempt is a page full of disconnected circles and squares!
It’s hard to make things easy, but we value organized process knowledge that empowers associates to THINK about cause-effect relationships, instead of simply being reduced to SOP OBEDIENCE.
The Walkabout method is a crucial part of our approach to continuous learning and management of a Correct, Consistent and Capable Operation.
When we learn something and can apply it – customer satisfaction improves. When we forget…
Call Center Strategy
“Happier Customers”
Call centers, now also called contact centers, have wrestled with the dilemma of service quality versus cost for decades. Wrong assumptions about what is important in call center operations lead to a no-win alternative: either throw money at the problem or live with customer dissatisfaction. Take a moment to review the conventional way of approaching this dilemma and then check out a better approach.
A LITTLE TELEPHONE HISTORY
One hundred years ago, a hands-on Danish mathematician climbed into Copenhagen manholes to study telephone traffic. Without knowing who called, why they called, what was discussed, or any other particulars, he began to mathematically describe what he saw.
By mathematically modeling call arrival times, Agner Krarup Erlang found that average call volumes and durations could predict busy signals, line utilization, and the number of rings until a circuit was connected. This, of course, applied to “calls in the wild”—anyone calling anyone for any reason or for no reason at all.
One interesting characteristic of Erlang calls is that call duration is heavily skewed to a shorter duration. Most calls are short, some are longer, and a few calls straggle in with extraordinarily long call duration.
Citing Erlang, conventional call center wisdom makes two big mistakes.
THE CONVENTIONAL APPROACH
Call centers look for ways to create large pools of agents. This is an “Erlang” strategy for coping with variation driven by call arrival times.
This might make sense in cases where there are only a few agents, and Erlang (“Erlang-C”) calculations support this. It’s obvious that a small team of agents will be able to take more calls and achieve higher utilizations than if they worked independently.
However, Erlang-C also predicts 90%-95% utilizations and short call hold times when call center sizes reach fifty to one hundred agents. This prediction rarely if ever holds true. Do we really think call center problems go away when they super-size their operations?
The advantages of agent pools diminish rapidly when they increase above the size of a small team. Something else begins to influence productivity!
Since popular workforce management packages have only Erlang call durations built into their assumptions, and since most call distribution systems are built to encourage large agent pools, tactical managers are taught to fight variation rather than properly manage it.
In the well-intentioned (but wrong) schools of call center management, supervisors are often taught these things:
- Insist that agents answer the phone as quickly as possible.
- Insist that agents complete the call as quickly as possible.
These two things are almost always improperly measured. They are treated as performance metrics and not process metrics. This wrongly prioritizes average duration over correct call handling.
It’s hard to believe—but it actually happened. One call center manager, in an attempt to motivate faster call handling, put on a fireman’s hat and ran through the floor shouting “Get off the phone!” whenever wait times spiked.
While extreme, this story illustrates a broader truth: many managers respond to service level pressure by pushing agents to take shortcuts, regardless of process quality or consistency.
WHAT CALL CENTERS CAN MANAGE
Processing time is a signature metric of a correct and consistent process.
A medium-rare steak takes a predictable number of minutes to cook (plus or minus). A haircut, updating an email address in a computer system, a 100-mile drive between two cities – these all take a very predictable amount of time if done correctly and consistently. Call center processes should be no different.
Well-defined processes take as long as they take, until and unless they are reengineered. Unfortunately, the urgency of ringing phones blind many managers to the issue at the heart of call center effectiveness. Agents are, in effect, continually being asked to “drive faster”—and the consequence is increased process variability.
Erlang’s traffic engineering formulas only take into account variability in call arrival times but have no real management advice on every other potential source of variation. It is, in effect, a “no smoking” policy in a burning house.
THE TOTAL VARIABILITY PICTURE
Take a look at the Pollaczek–Khintchine equation that describes the relationship between wait time, call processing time, utilization, and total call handling variability. The three lines represent estimated average wait times with increasing levels of variability.
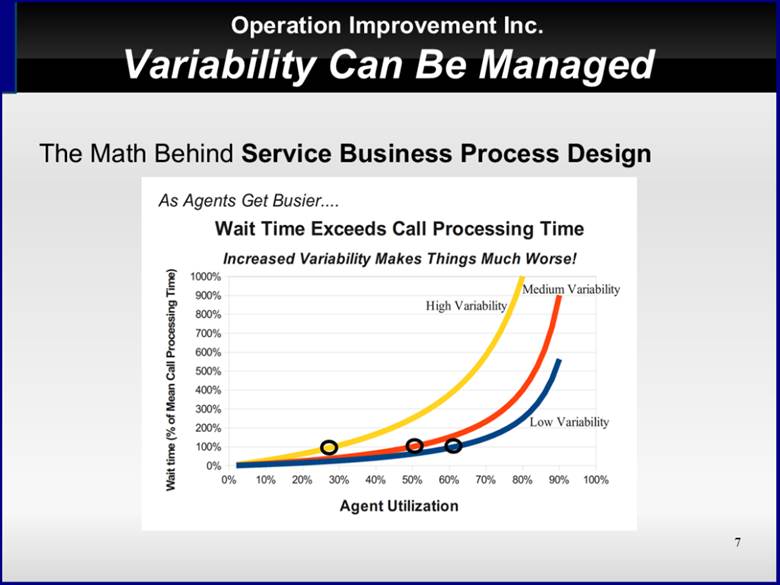
Figure 1 Wait times increase rapidly as call handling variability rises
Erlang demonstrated this “hockey-stick” effect with just arrival times, but this pattern is true of every source of call handling variation in the call center operation.
Instead of just focusing on call handling time, measure and monitor the variability of call handling time. Then begin to study what factors can make handling times more consistent and reduce variability
Managing and lowering this source variability will rapidly improve call center utilization, reduce wait times, lower costs, and improve the quality of customer service. The prime directive of the operations manager is to manage variability by running correct, consistent, and capable processes.
If the only source of variability was in call arrival, managing this would simply be a matter of scheduling – of contouring start times and staffing levels to demand of service.
Look at this actual data from a high-volume call center. Week after week, this same arrival pattern reliably appeared in the 15-minute interval data.
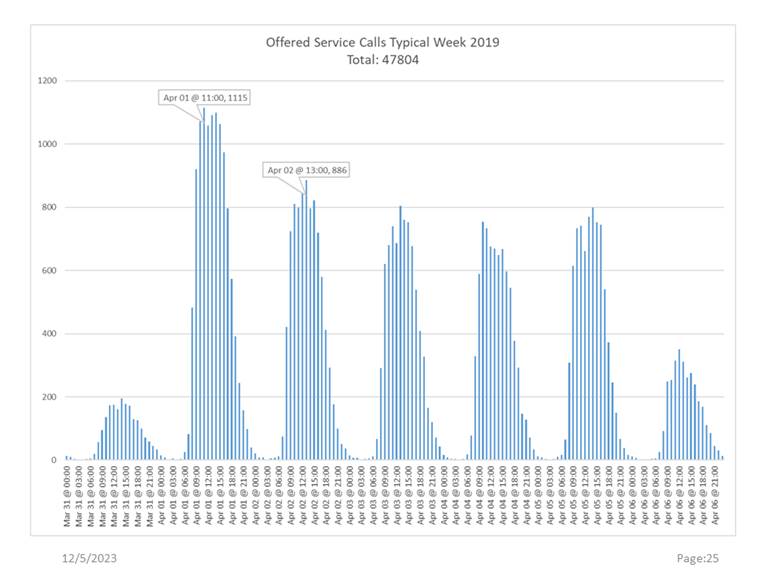
Figure 2 Number of Calls Arriving in 15 minute intervals for an entire week
Exceptions to this repeating pattern did occasionally occur, but they were exceptions with an identified cause. In infrastructure support, a major outage can overwhelm the best operation. In sales and marketing customer support operations are sometimes blindsided by “surprise” ad campaigns announcing a new product or service.
MANAGING VARIABILITY APPROACH
Of course, the usual metrics of wait times, queue backlogs, and call volumes must be monitored; but avoid immediately aggregating them into daily or monthly statistics. Start with time series analysis and strive for near-real time data updates before rolling this up into a daily or monthly performance analysis. Monitor call variability in a similar manner.
Analyze and group calls of like kind – both in duration and content. Create small right-sized “Erlang” teams to handle calls of the same type. Use advanced call routing techniques (e.g. “skill based routing”) with caution to be sure you can control what calls go to what agents.
Walk through in writing what should happen with each call type. Create career paths for agents so that new agents can quickly become productive on simpler call types, and gradually transition to more complex ones as they gain experience.
Track the same metrics discussed so far and in the same manner for each team/call type. Be prepared to “flex” staffing by moving senior agents back to familiar and simpler call types
Finally, staff each team’s capacity to meet the demand profile of their call type, and not the aggregate call arrival profile of the entire organization.
In short, improving call center performance isn’t just about scheduling and scaling—it’s about systematically managing variability. When call handling processes are consistent, predictable, and aligned with agent capability, the entire operation becomes more effective, responsive, and affordable.
To learn more about this approach, visit https://effectivecallcenters.com, and read about some of our client successes.
Copyright © 2025 Operation Improvement Inc. All rights reserved.
Frame of Reference: The Rest of the Story
A few years ago, I did some consulting and training for a manufacturing company. Components of their products were made from metal castings with precision requirements tighter than one-thousandth of an inch.
The company struggled to meet these demanding product targets. Within a couple of weeks, I identified a fundamental error repeated across three areas.
As you read, look for the common thread in the three situations I investigated. Then ask yourself: “If I were the manager, what would I do differently?”
Blueprints
All of the rough castings were machined to ultimately comply with mechanical drawings (“blueprints”). After some research into the prints, I made an interesting discovery. Many of the prints had a common flaw.
Let me help you picture the situation. Imagine that a hole is to be drilled into an eight-inch-wide block. The blueprint calls for the hole’s center to be exactly four inches from the left edge and five inches from the right—on an eight-inch-wide block.
Visualize it. Do the math. You’ll notice the problem: the instructions are contradictory.
The drawing is ambiguous—there are two equally plausible locations for the hole.
Errors of this sort are avoided in drawings by measuring all dimensions from a single common reference point or surface. A single frame of reference means that everyone interprets blueprints and measurements in the same way.
Many of the engineering drawings contained these multiple reference point errors, and I brought this to the attention of management.
Now, if you were responsible for managing this company, what would you do?
Presort
I further researched the machining processes and found a work center composed of a long line of traditional machining workstations. Rough metal castings were first processed on workstation number one. Each subsequent workstation added one cut and finished parts were produced at the end of the line.
This pipeline machining design had tremendous potential to rapidly produce large volumes of product. Like an assembly line, once each piece of equipment was configured, production flowed through the line and all workstations ran in parallel until an order was complete.
The first machining work center was critical—it established a smooth, flat reference surface for all subsequent operations.
However, there was a problem. The finished parts varied significantly—some exceeded customer tolerances and had to be scrapped. A simple statistical analysis showed four distinct groups, which corresponded with a distinctive casting mark on each part.
Four different molds (“A, B, C, or D”) were used in casting the rough metal parts. Parts that came from mold “A” were very much like any other one from “A” but different from parts from mold “B”. The difference was small but sufficient to account for the end-of-line variance and scrap.
I proposed a simple modification to the workcenter: sort castings by mold immediately before machining workstation number one. Castings marked “A” would be processed, and then the cutting machines would be recalibrated before “B” parts would run. Each mold group—A, B, C, and D—would be machined as a batch with its peers.
We did an experiment. We tested the sorting-by-mold theory. Setup time was dramatically reduced! A first piece quality check came back without delay. Every part now left the first machining work center with a consistent reference surface, and the finished parts came out at the end of the machining line as the same and not as four flavors.
Now, after this little experiment succeeded, if it were your facility and your money, what would you do?
The Eight-Station Turntable
One work center featured a round turntable design. Seven stations with cutting tools were arranged around the table, with the eighth reserved for the operator to load and unload parts.
The operator would unload a finished part, load a fresh part, and then start the cycle. The table would rotate 45 degrees, and each of the seven machining stations would go to work on their respective parts.
The machine had a terrible reputation with the operators, and no one wanted to be responsible for setting it up for a customer order. After some investigation, I found out why.
The two stations with cutting tools on either side of the operator and the center of the table were designed to form a perfect 90-degree angle for reference and measurement. All placement of fixtures on the table and all positioning of the remaining five stations and cutting tools were to be made based on this objective and absolute frame of reference. The sequence of setup and positioning these fixtures and tools was critical!
It turned out that someone had unbolted and repositioned one of the critical reference stations in a trial-and-error attempt to set up the machine. The perfect right built into the workstation’s design of the workstation was broken, and an 89- or 91-degree angle had taken its place. It was now impossible to perform precision machining at this work center.
I recommended correctly repositioning the two critical stations relative to the center of the table, reestablishing the frame of reference for setup, and then I designed and shared a correct setup sequence for the fixtures and tools. (This required the machine manufacturer’s assistance and the use of precision laser measurement tools.)
So once again, if it were your responsibility, what would you do?
The Rest of the Story
Regarding the blueprints: The company decided to do nothing.
Regarding the new presort work center: The company decided to do nothing.
Regarding the machine damaged by an untrained setup operator: The company decided to do nothing and to leave the machine as it was; continuing to approximate a correct setup by trial and error.
If this is puzzling to you, a recent post on “X”, Scott Adams (https://x.com/ScottAdamsSays) sheds some light on this behavior. He noted that many times, people fall into a habit of evaluating a task by its effort rather than its reward. So true for all of us, unless we think!
The next time someone tells you, “We’ve got certifications—we tried Six Sigma, SPC, process management, measurement studies and more – and they didn’t help”; pause and dig deeper. Remember this “Frame of Reference” tale and ask for the rest of the story.
In manufacturing, ignoring root causes while expecting different results is wishful thinking. “If you continue to do what you always did, you’ll get what you always got.”
Copyright © 2025 Operation Improvement Inc. All rights reserved.
Division of Labor in Decision Making
“Organizing Operations”
James Abbott devoted considerable time studying policy, strategy, and tactics before we developed our “Division of Labor in Decision Making” concepts. For some, his distinction between strategy and tactics is unconventional, but it follows directly from the dictionary distinction that tactics employ available means.
TACTICAL DECISIONS
The A-Team was a 1980s TV show about former Special Forces soldiers who routinely improvised with available resources. They could turn a civilian jeep into an armored vehicle with scrap metal and a welding torch. In a similar fashion, tactical decisions in operations often require redeploying available resources when things do not go according to plan.
In any business of a moderate size, first-level (tactical) managers may have budget and P&L responsibilities, but they will not typically have balance sheet responsibilities. They will not, for example, be able to borrow money or have independent authority to make capital purchases. These are strategic issues.
Tactical managers are responsible for the correct and consistent operation of the facilities and resources provided. In a restaurant, for example, a strategic decision has been made to buy and use tables designed for a party of four.
The tactical manager cannot stack customers on top of one another, and they cannot raid the cash register and buy a couple of tables for six. They can, however, pull two tables together to seat a larger group. That is what is meant by redeployment of resources—managing with available means.
STRATEGIC DECISIONS
In a small business, an owner may “wear many hats”, making strategic decisions one moment and tactical ones the next. Division of Labor in Decision-Making is something that happens when a certain scale is reached.
A small town is likely to have a physician in general practice but unlikely to have enough work for a specialty like brain surgery. The opportunity to specialize in a certain kind of work emerges with scale. When there is sufficient work of a certain kind, a specialty, like strategic management, is created.
Strategic decision makers define the product and set customer expectations. They choose facility locations, decide whether to rent or buy needed buildings, equipment, and tools. They are responsible for sufficient cash and inventory reserves, and more. In short, they provide facilities that should be capable of meeting or exceeding customer expectations.
DIVISION OF LABOR VIOLATIONS
A violation of the division of labor almost always results in unjust blame and misplaced accountability.
Violation #1
A rough fabrication shop has cutting and measuring tools for rough dimensional measurement—the rulers are precise to 1/16 inch. Strategic management courts customers with precision fabrication needs and hundredth-inch tolerances. The sales department takes the order and assures the customer, “No Problem!”
This violation is called No Thought to Capability. (A mistake by Strategic Management.) Who should be responsible when the customer is dissatisfied? Strategic management is responsible for providing facilities that can meet and exceed customer expectations! Where are the tools needed to perform this job?
The original Motorola Six Sigma program was a strategic engineering initiative, and not a tactical operations program. Its focus was to ensure that manufacturing systems and product designs were capable of substantially exceeding the toughest customer specifications. Six Sigma perfections was required of every single transistor out of the millions on a single computer chip because a single failure could cause the entire component to be scrapped.
Violation #2
It’s 3 PM and the metal punch machine reliably cuts sixty pieces per hour. Two hundred pieces were promised by the end of the shift at 5 PM. If the supervisor attempts to speed up the machine it will increase waste and scrap. This is called a Forced Capability violation. (A mistake of Tactical Management.) The tactician is failing to run the process correctly and consistently.
When strategic management takes full responsibility for matching an operation’s capabilities to customer expectations, and when tactical management commits to correct and consistent operation, then an organization will find its peak performance.
When we fail to separate issues of customer expectations and capabilities from proper operational practices, we inevitably have failures and misplaced blame.
Respect for the principle of Division of Labor in Decision-Making creates a clear demarcation of two fundamentally different business decisions. It facilitates the creation of a culture of fairness and transparency. It is a primary key to apportioning accountability properly matched with authority.
James Abbott’s classes on service and manufacturing management are the definitive presentation of Division of Labor in Decision-Making, and I refer you to that material for a deeper discussion and will conclude by introducing one final element.
POLICY DECISIONS
Tacticians deal with particulars. “This person will do that particular thing with these resources.”
Strategic thinking is more abstract. “Someone” and “Somehow” start out in strategic thinking as blanks to be filled in later. Good strategic managers know that someone and somehow must later be replaced with a particular “Who” and “How”, but those particulars are set aside as they think in principle about how to achieve company goals.
Strategic managers weigh values and risks. Through advertising, marketing, and sales, they set product expectations in the minds of customers. Through capital expenditure, they attempt to provide facilities and tools that give our operations the capability to meet and exceed those customer expectations.
Just as strategy provides a kind of guidance and structure in which tacticians can act with confidence and certainty, there is a higher level of decision-making that provides similar guidance to the strategist. Policy Decisions provide that guidance.
Ultimately, the purpose and methods of cooperative effort must be guided by very concise ideas that are easy to grasp. Some call that, “The elevator pitch”. Every successful organization has top leadership that can clearly and concisely articulate what business we are in. Mission and Vision are the articulation of means and ends of Policy.
CONSEQUENCES OF POLICY DECISIONS
Policy Decisions reflect the organization’s reason for being. It is not decided by committee, but it requires consensus and whole-hearted support is expected from all – even associates who do not personally use or consume the company’s products!
“Reliable communications with anyone, anytime, and anywhere” is the kind of concise and focused guidance that Policy gives to dozens of strategic goals and hundreds of tactical objectives in a telecommunications firm.
But look: Reliable, affordable communications with anyone, anytime, and anywhere”; the addition of just one word can change the entire meaning, potentially changing a company’s fate from failure to success. When there is any substantial clarification of policy, every strategic and tactical decision maker must reassess and realign their thinking as this one addition illustrates.
A concise, transparent, and consistent vision and mission statement is the objective standard by which goals and objectives are selected or rejected. It is the key to keeping an organization cohesive and pointed in a common direction.
Copyright © 2025 Operation Improvement Inc. All rights reserved.
Contact Us
Got Two Minutes?

oi Business Services