Archive
Rational Team Building
Re-organization and teams are the perennials in the management improvement garden. Popping their heads above ground every weak financial spring, hope springs eternal for these two old favorites. While these venerable strategies do occasionally work to rejuvenate an organization, it isn’t magic. Understanding that fact is the key to more than occasional success.
With teams, the intent is to bring people together and charge them with a common purpose in the hope that they will somehow be more productive than individuals. For true believers, the somehow is guaranteed by faith and philosophy, but there are those of us who have seen teams perform worse than the proverbial “one good engineer.”
Teams can be rationally formed, or they can be malformed. They can be too big, be organized badly, or composed of the wrong people. Just as competent individuals are the building blocks of successful teams, properly formed teams are the building blocks of larger organizational structures. (In this strict use of the word, thirty people cannot form a team.)
In this article, we will focus on the issue of staffing a team. In another time and place we can discuss in more detail why teams need to be small (no more than six individuals), why the team leader is expected to be a working member of the team, and why the team leader is not the same as a supervisor, manager, or coach. (A supervisor may be responsible for 2–4 teams.)
Teams have intrinsic inefficiencies. Team members need to communicate and to closely coordinate their actions. Consequently, team communication and team meetings are often considered boring, time-consuming, and a necessary evil. The larger the team, the more these overhead costs drain productivity.
Teams can still be outstanding producers despite this innate disadvantage. They just need to be formed in such a way that they exploit one of several established principles of productivity.
- Division of Labor. It has been known for generations that cooperating specialists can be more productive than generalists, if there is sufficient work to keep the specialty occupied. If there is not sufficient work, then the specialty work is absorbed into the closest skill match.
You can take advantage of this principle by staffing a team with different backgrounds and skills. A team with a diversity of skills can maximize productivity if there is sufficient work to justify each specialty.
- Many Hands Make Light Work. There are many jobs that are unpleasant, tedious, and boring. Nevertheless, they must be done. A single good trooper who is assigned to swamp-draining duties may intellectually appreciate that every job is important, but a long, dreary task can sap the morale and productivity of the best.
This kind of assignment generally calls for similar backgrounds and skills. A friendly peer is the best kind of team member to have by one’s side when there is an undesirable assignment to be slogged through.
- Perspectives Generate Ideas. Once again, here is a reason to staff a team with individuals selected for their different backgrounds and skills. There are times when we are idea-poor and are looking for a fresh approach to a market, to a new product, or for a problem solution.
Teams of like mind tend to hash over the same old talking points and repeatedly converge on the same solution. Worse, as a result, they may deem their conclusion the best alternative because they do not have the benefit of a radically different perspective.
- Safety in Numbers. A team can be more productive than individuals if teams are formed as a risk-reduction strategy. Think of this as adding a co-pilot or a spotter in any task where a single misstep or sudden loss of a key individual can be catastrophic.
Similar backgrounds and skills would be characteristic of this kind of team. Here the advantage is intangible, and a manager would need a good quantitative understanding of risk to fully appreciate what is bought by adding redundant team members.
What is the conclusion? Don’t expect a team to be somehow more effective or motivated than the enthusiastic and committed individual. Form teams for a reason. Have an idea as to how a team might be more productive in a given situation. Then, staff the team accordingly, with individuals selected for either their common or complementary abilities. If you can’t make a case for a team, then don’t forget the effectiveness of “one good engineer.”
Copyright © 2025 Operation Improvement Inc. All rights reserved.
Criticism, Responsibility and Blame
I remember two things about my second-grade school year. In those days before classroom computing, my homeroom was just across from the school library. I also remember something else – something less pleasant.
I was falsely accused! It was a serious offense for a second grader. The teacher said that I had littered. Horrors! She claimed that I had intentionally thrown down paper instead of… I don’t know what. I don’t remember the rest, except perhaps that I had lost some crumpled paper from my tiny back pocket.
I was caught off-guard by what was a stinging accusation for a seven-year-old child, and it is something that I will never forget.
My wife still remembers a third-grade teacher who impatiently gave her a slap on the bottom for pausing to make sure her first-grade sister was safely aboard a school bus.
I laugh at myself for still remembering my ancient slight. I reflect and realize how lucky my life has been in that the injustices I have suffered have been few and minor. Everyone has a few of these tiny scars, but some have suffered unfairness in life a million-fold greater.
TRUTH AND JUSTICE
It seems that all of us carry around a little internal scale of justice from our earliest years. If a brother or sister gets a larger slice of cake, an alarm bell rings. If a co-worker gets a raise and we don’t, another warning bell chimes.
It is both the blessing and curse of being human. Of all the animals, we spend a lot of our time and mental energy contemplating what we and others ought to do.
If the guilty are rewarded and no good deed goes unpunished, our internal scales of justice tilt, and we begin to rebel at what we perceive is wrong.
More employee issues are rooted in matters of perceived unfairness and injustice than any other. Commission and bonus policies, accountability and blame, shift and vacation schedules, workplace courtesy, and many more problems like these trace their origins back to a common theme.
If one worker is excused for being late and another is not, everyone makes a mental note. If someone receives a favorable shift or assignment for no apparent reason, a real or imagined prejudicial and personal relationship may be blamed. Even the lightest criticism can poison an attitude if the recipient feels the criticism is undeserved and unearned.
From entry-level positions up, I have always found that most people start a work environment eager to contribute. Excepting previous bad experiences that color their expectations, most workers hope and expect to be productive and to be treated fairly in the process.
There are many books about motivation and business culture. From these sources, we learn that there are many small things that a manager can do to enhance and mature positive attitudes, but there is one huge thing that is destructive unless handled properly.
There must be an unwavering commitment to transparency and consistency on what is deserved and what is earned in both real and perceived rewards and penalties.
DESERVED AND EARNED
A certain amount of conflict is inevitable. Fans of fiction know that much of the drama in stories of romance, mystery, and suspense is rooted in conflicting ideas about what is deserved and what is earned.
Dark stories tell us that people don’t always get what they deserve, and heroic adventures tell us that they sometimes do. Thrillers with courtroom confessions often find the guilty making hollow appeals to justice. “I earned that money. They had it coming to them.”
Indeed, if there was perfect agreement with and abidance by a common understanding of justice, then there would be little for the courts, the police, and the military to do.
The reality is that people will come into our workplace with differences in knowledge, understanding, maturity, and intent. A child does not earn their bed and dinner, but these are things they deserve from their parents. The adult who models their work expectations too heavily on family experiences may clash with someone from an entrepreneurial, strongly hierarchical, or class-oriented culture.
You can expect that individuals will bring expectations of privileges and entitlements based on position, rank, class, education, and need as well as merit. The challenge is to create an environment where extraneous differences can be respectfully set aside, leaving only issues pertaining to the common goal: to work productively together.
A HARMONIOUS WORKPLACE
Even though people come to the workplace with different expectations, it is still possible to create an environment in which you can earn the coveted title of tough but fair.
When someone steps up to play a new sport, they expect to have to learn new rules. In soccer, the use of hands is penalized. In basketball, traveling with the ball is not allowed.
In a new work environment, people are receptive to receiving and abiding by a work-specific set of ground rules for behavior.
You must remember, though, that money talks. “I did not pay them to be rude to customers!” said one manager. “But you did!” I reminded him. “Yesterday was payday! Didn’t they get paid?”
If a referee never calls fouls, players feel free to commit them. If there are no consequences for negative behavior, associates will assume that correct and consistent process is only a suggestion.
DALE CARNEGIE
How to Win Friends and Influence People was a salesman’s bible for many thousands in the last century. His most memorable advice was to “Never, Never Criticize.”
This advice is closely tied to the theme of this article. Many times, people experience criticism as an injustice. Coaching can be different. Coaching deals explicitly and exclusively with what an individual acknowledges they can control.
A barrage of criticism generally provokes resentment and not change. “What can I do about spilled milk? Water under the bridge? Someone else was at least partly at fault.”
You cannot help someone else clarify their thinking as to what they can and cannot control unless you are crystal clear on this distinction yourself.
Don’t forget that we are talking about is and not ought. What someone ought to be able to control somehow is not the clear and detailed thinking of a good tactical manager. A future article on the principle of Division of Labor in Decision-Making will delve deeper into this subject.
ERRORS OF KNOWLEDGE
Our earlier article on variability introduced the idea that experience should result in increased knowledge. One important take-away from this book should be several techniques for retaining and organizing that knowledge.
From the dependency diagrams to factor tables and visual documentation techniques to proper methods of organizing metrics to highlight the ideas hidden in data, I encourage you to take advantage of these as are appropriate for your situation.
It is usually inadequate to simply tell an associate some fact, policy, or other guidance as to how to perform their job. They are as likely to remember seventeen workplace rules as they are likely to accurately retain seventeen-digit part numbers.
The best pilots still use preflight checklists no matter what their level of experience. Good tactical managers should not simply rely on associates remembering everything that is important about their job.
SEX, POLITICS, AND RELIGION
Sex, politics, and religion are the original big three verboten topics during business hours. The list is a little longer today.
Although there is great pleasure in seeking out and sharing time and conversation with people who share our philosophical perspectives on life, it is still asking for trouble to open up these issues at work, unless these matters are our work. The subject of sex will inevitably come up in some form at the condom factory. It need not be discussed at the furniture plant.
Setting aside these issues in the workplace is a contract to agree to disagree. It is a respectful attitude that acknowledges the different opinions we hold regarding the earned and deserved but sets them aside for our common virtue—the desire to be productive.
GETTING “PLAYED”
If you take fair treatment of customers and associates seriously, you must be on your guard against those who play on your sense of justice.
Did you make a mistake? Did you mistreat someone, or are you being played? Unearned and deserved guilt feels exactly the same.
Your commitment to know your own mind, to fully understand what you can control and what you cannot, what others can control and cannot, and your willingness to correct your thinking when you are wrong is your only defense against getting manipulated by cynical opportunists whose ideas about justice are, shall we say, flexible.
FINAL THOUGHTS
Resist the urge to cultivate a parent-child relationship with people who report to you. This can cultivate a culture of entitlement along the lines of Judith Bardwick’s Comfort Zone.
There is an element in supervision that we call air cover. Good managers watch for and intercept pressures and events from above and from outside the team that can undermine associates’ ability to focus on their tasks. Although this feels like parenting, it is simply part of the job of a good tactical manager.
Resist the urge to characterize your management style as democracy or dictatorship. Concepts of politics do not belong in business. It is reasonable to poll associates and vote on serious matters in which they have a personal stake, but it is a mistake to call the question on every trivial matter, particularly if the result is a foregone conclusion.
Keep the distinction between perks and privileges, compensation and generosity. If you provide a free lunch to squeeze a few extra minutes of time from staff during a crisis, don’t spin it as generosity or a privilege. At best, you will fool no one. At worst, you will modify employee expectations. When free pizza lunches go away, someone will feel cheated.
I’ll never forget the restroom signs to employees in a large manufacturing plant: “We have generously provided these facilities here for your convenience.” Really?
Legalities and building codes aside, just how convenient would it be for the business if there were no facilities? A sign that said “We provide these restrooms close to your workstation so you can get back to work ASAP” would be more honest, but does the obvious really need to be said?
Copyright © 2025 Operation Improvement Inc. All rights reserved.
Software Project Management Callback
Waterfall Project Management
“Waterfall” project management is a style of management best suited to the assembly and integration of proven processes and skills. In residential contracting, we work from plans, measure twice and cut once.
The materials, techniques, and skills required are known quantities. The quantities of steel, concrete, wiring, plumbing, and fixtures can be estimated from the plans, and established labor ratios can be applied to quantify the human component.
The challenge in these kinds of projects is wise management of the critical path, and the ability to adapt to early and late delivery, price surprises, material defects, resource scheduling conflicts, human error, and project changes.
In “waterfall”, the project manager is given an objective expressed as performance, time, and cost and must optimize these three variables while considering project risk.
Software project management is different.
By software development, I am not referring to routine low-code/no-code projects where workflows are tweaked, data is re-coded, and BI engine reports are created. Such endeavors today, especially with the assistance of AI have almost become predictable processes.
I am talking about software development where the development team must envision and create something new – much like a writer must create a fresh story in a series of entertaining books or scripts. They must imagine new usage cases, unintended consequences, and the product’s evolution along a future development roadmap.
A book author will often start with a conceptual sketch and prepare a rough outline of the written journey from start through exposition to conclusion. Details are filled in, usually not in the final chapter-by-chapter order, and drafts are refined until the story’s message is coherent, clear and impactful.
This kind of iterative development is a process of systematic discovery.
Iterative Development
The conceptual alternative to “waterfall” can generically be termed “iterative development,” and it is an approach that is decades old, and it predates computer technology and code creation, and has many applications outside of IT.
Fredrick Brooks, the well-known UNC computer scientist and thought leader, had some success with waterfall techniques when he redesigned the roles of a lean programming team. His original book, The Mythical Man-Month, is a classic of software development and gave us several guiding principles including: “Adding programmers to a late project will make it later.”
In subsequent editions of this book 20 years later, he explored the concept of iterative development. In simplest terms, it builds on the lean programming team model and adds iterative development constraints.
A development cycle is a short, relatively fixed time-period where an application is constructed and enhanced with only the functionality that the time budget allows. He calls this “growing a program.” This approach turns learning, discovery, and invention into a manageable process.
At each stage of development, the result is both a working product and a prototype for the next iteration. With this approach, nuances of a new language or strengths/limitations of a chosen framework of building-block functions can be explored, and adjustments can be made as necessary.
Project planning is developmental. Much like curriculum development for first, fifth, and 12th grade education, project planning has a vision, or outline, for what the product could look like at different stages of development. You can see that this lean style of iterative project management is “baked into” the DevOps and CI/CD methods and tools offered by AWS cloud services.
With either “waterfall” or “iterative” management, one wants control and desires to avoid the pitfall of the illusion of control. Project management skeptics who are aware of such illusions sometimes ask why plan at all?
I ask them to imagine productivity if we planned 100% of the time (the answer is none), and then I make the case that activity without performance-time-cost objectives will not deliver value. What is the value of the perfect wedding cake delivered a week after the wedding? What if the cake is cheap and on-time but looks and tastes awful?
Without a sense of where we are going, where we are, and an idea of how to get from here to there, the risk of failure is almost certain. A sweet spot of planning and control is somewhere in between no plan and an obsessive attempt at over-control. However, when we encounter those things we cannot control, we realize that plans must change; and that is okay.
An interesting X post had detailed criticisms of SCRUM and other recent academic attempts to build management layers on the thirty-year-old lean development framework of Dr. Brooks. The X writer did not reference The Mythical Man-Month, but the book certainly came to my mind when I read the online comments and replies.
On reflection, it also made me remember the advice: “…things I can control, the things I can’t. The wisdom to know the difference.”
© Operation Improvement Inc 2025. All rights reserved.
Dependencies and The Decision-Making Sequence
What is wrong with this management agreement?
Original: “The managing agency shall be paid 8% of gross revenues each month on or before the 25th.”
(Here is a hint: Look at the re-worded agreement, clarifying understanding and remove any ambiguity.)
Revised: “The managing agency shall be paid 8% of the preceding month’s gross revenues each month on or before the 25th.”
There are two activities implied in each of these two statements. (1) One month’s gross revenues shall be totaled. (2) Eight percent of the total shall be calculated and paid.
A dependency diagram would make this clear. Calculating a (prior) month’s gross income comes first, and calculation of a management fee is a dependency, but it is not simply a dependency in time!
Most people assume that dependency diagrams are flow charts or time sequence charts. They are NOT!.
Dependency Diagrams are best described as knowledge and product dependency Diagrams
Transient Products
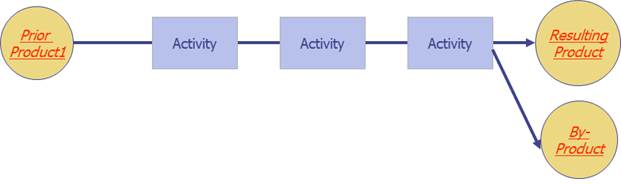
Each process activity box in a dependency diagram could be drawn on a separate page. A resulting product could be shown for each process step, and that product could be shown as the key ingredient, or incoming product, to a subsequent step.
Instead, these transient products are typically not shown, unless a deeper level of detail is really required to understand the work. Process steps are connected one to the next, and these transient products are implied in the diagram.
In the management agreement example, the calculation of gross revenues produces a product: a dollar sum. That transient product (the dollar sum) is the input to the calculation of a percent management fee.
If a transient product is flawed, all subsequent process steps are voided!
The dependency diagram for calculating management fees reminds us that a correct percentage calculation depends on a correct sum of the previous monthly revenue. If prior months revenue calculations are incorrect, all downstream calculations are null and void.!
It is an understandable mistake to think that dependency diagrams show time sequence, but the deeper interpretation is that a bookkeeper must know the monthly revenue sum before a correct management fee can be calculated. It is in this sense that dependencies illustrate knowledge dependencies.
Dependencies In Project Management
Dependency diagrams are a essential tool in process management, but the concept of knowledge dependencies may be clearer if we draw a couple of examples from the other branch of tactical management: Project Management.
Knowledge dependencies may be clearer if we take a look at PERT chart techniques in project task scheduling.
In a systematic scheduling of tasks, task relationships are typically described as predecessor and successor tasks. Tasks are related in one of four ways: Finish-Start (FS), Start-Start (SS), Start-Finish (SF), and Finish-Finish (FF). In addition, a gap or overlap is specified as lead or lag time.
Novice schedulers just “know” that Task A (Build Forms) should happen on Monday and Tuesday, and Task B (Pour Concrete) should follow on Wednesday and Thursday.
If they use a software package, they fiddle with task dependencies and leads and lags until the two tasks appear on the calendar where they intended. This is not how these powerful tools were meant to be used.
The concrete contractors, let us say, are our most difficult to schedule workers. They have promised to bring concrete to our work site on Wednesday. That is the predecessor task. It is a bit of certainty that the rest of the schedule builds on.
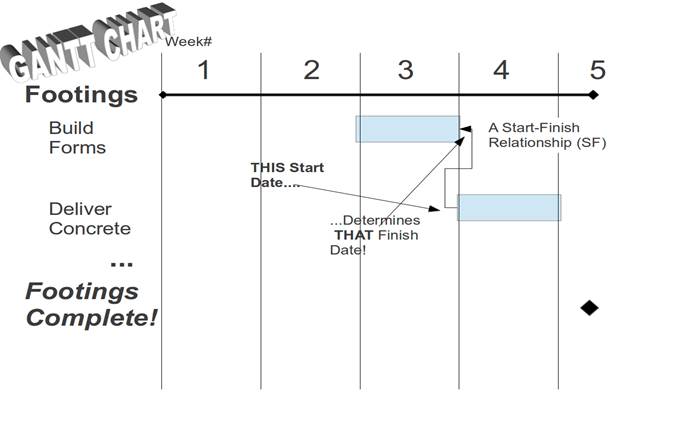
Based on the knowledge that the concrete will be delivered on Wednesday, we establish a relationship with the successor task. We calculate that the building of forms to hold wet concrete must be finished before concrete is delivered on Wednesday. That is a Start-Finish relationship.
Since construction of footings is expected to be a two-day process, we determine a starting date for that task by the powerful mathematical technique known as subtraction. We work backwards on the calendar to find the Monday starting date of Task A.
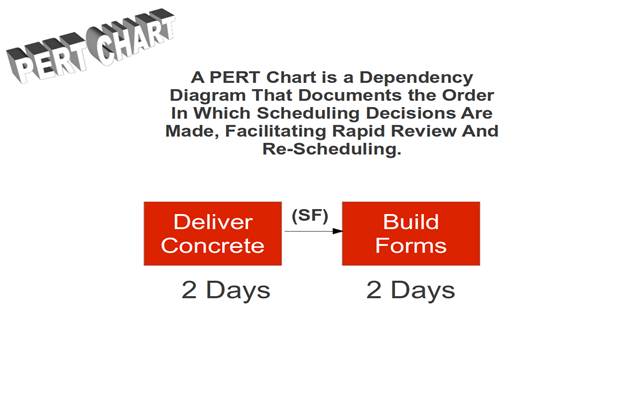
The Gantt chart shows the time sequence: A precedes B. But the PERT chart preserves the knowledge dependency relationship.
On the PERT chart view, Task B (Concrete) comes first, and Task A (Forms) follows. This is because we know with some degree of certainty when concrete will be delivered, and we are planning the other tasks accordingly.
We plan because there will be change. Things will not always go according to plan. If the concrete contractors reschedule, the PERT chart and the Start-Finish dependencies in our scheduling plan remind us which tasks must be rescheduled.
In process and project management, the tactical manager’s “go-to”move is re-deployment of resources in order to accommodate change, substitute equipment and methods, and in some cases – shorten the duration of resource-driven tasks.
The dependency diagram retains a record of causality in our decision-making. “Why did we schedule form construction when we did? Because the concrete contractors go on the schedule first, and other tasks are scheduled and rescheduled accordingly.”
Critical Path
Dependencies are used sparingly in project scheduling to represent real constraints. In our example, the difficulty of scheduling concrete had an impact on at least one other task.
A prepared bed for concrete complete with forms is something that may be perishable. Perhaps we do not want that work completed and left exposed to the elements for too long before concrete is delivered. There is a definite reason to incorporate this dependency in scheduling.
Other tasks are scheduled later by analyzing available resources. The limitation of workers and equipment keeps us from tackling every task simultaneously, and a project manager will work that out in a second phase of scheduling.
For now, these tasks that are independent are left on the schedule to start ASAP (as soon as possible). Resource limitations will cause some of these to be delayed.
At this early stage of scheduling, something called a critical path emerges. It is possible to identify a sequence of tasks that determine the minimum total duration of a project.
If there are no dependencies in a project and everything is scheduled ASAP, the critical path is simply the time it takes to complete the longest task.
When product and knowledge dependencies are identified and incorporated into the schedule, a realistic timeline of the project begins to take shape.
Novice misuse of scheduling software and dependency-based scheduling often results in everything being linked into a too long critical path. This creates unrealistically long estimates of the total project duration and leads the manager to think their only means of improvement is more resources.
Proper and sparing use of dependencies and ASAP scheduling gives the tactical manager options. They can choose where and when to deploy and redeploy resources. They can lengthen non-critical tasks and shorten tasks on the critical path.
When things change, when things do not go according to plan, the most powerful tool in the tactical manager’s kit is the power to redeploy resources. A good plan establishes contingencies in advance.
The Factor Table
Dependency diagrams are not flow charts. Particularly in process management, they represent a planning of work that proceeds from certainty to certainty, from correct product to correct product.
How, then, can such a simple method for diagramming processes be made flexible enough to accommodate variability and unknowns?
Many are tempted to turn dependency diagrams into flow charts. They want to introduce decision box symbols and branching and looping lines and arrows. This is not only unnecessary; it is a mistake that will have a negative impact on the ability of a tactical team to work confidently, correctly, and consistently.
In another article, we apply dependency diagramming to work in call centers. In that call center example, our process is to greet, identify the caller, and then match the call request. Callers can call about a multitude of things.
Even if we factor the types of calls into a smaller and manageable number, how then does the manager maintain a sense of orderly correctness with a simple dependency diagram? If we decree that there are a dozen different types of calls, do we make a dozen dependency diagrams to plan and describe each process variant?
The answer is no, and the solution is something called factor tables. A discussion of factor tables deserves its own article in this series. Once mastered, you will never be tempted to turn dependency diagrams into flow charts.
© Operation Improvement Inc 2025. All rights reserved.
Got Two Minutes?