Every process has a product and a by-product.
Early in my consulting work, we were doing a series of Quality training classes at a plant in Tennessee. My associate, James, asked the class about “scrap”. The class said we don’t have a scrap problem, and James held up a little tip of rubber – a trimming from a finished product that amounted to a significant quantity every month.
Every process has a product and a by-product. The “product” of an operation is often subjected to inspections, reporting and analysis that we call “burnt biscuit reports.”. Even if a facility is fortunate and has no “burnt biscuits”, there are still opportunities to learn and improve by, for example, examining the by-products of production.
Of course, Statistical Process Control looks at the processes that -make- the biscuits. It moves the focus from biscuits to baking. When we are “baking”, “mixing”, “pouring”, “cooling”; we want metrics that we can quantify critical aspects of those actions in addition to those of the product.
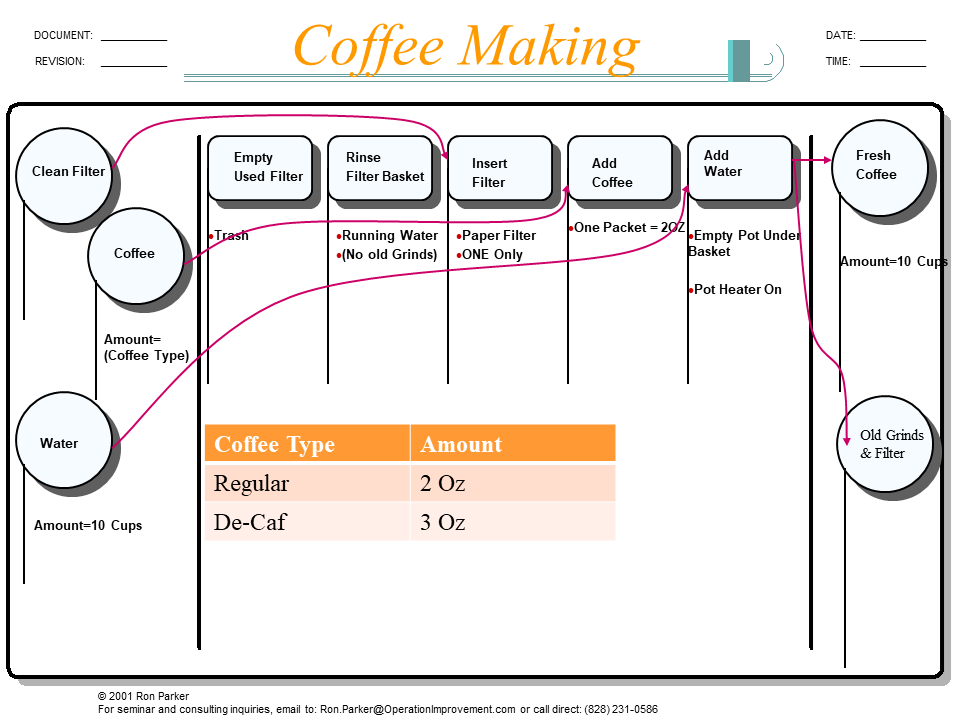
Finally, the input of every process is the output of a predecessor. A “Walkabout” style visualization pulls together the important relationships between incoming product, process, outgoing product metrics, and by-product!. We describe it as a way to “learn, share, teach and improve”.
Some call this style of documentation, a “functional block diagram”. Our use of the technique began by understanding its traditional use for “divide and conquer” signal tracing in the electronics industry. We then adapted it to latex form and mold manufacturing, hydraulic valve machining and assembly, chemical baths and plating, IT support processes, call center/telephony processes, and more.
If you find this approach helpful, check out these books: The Abbott Walkabout Series & Thirtysevenideas.com
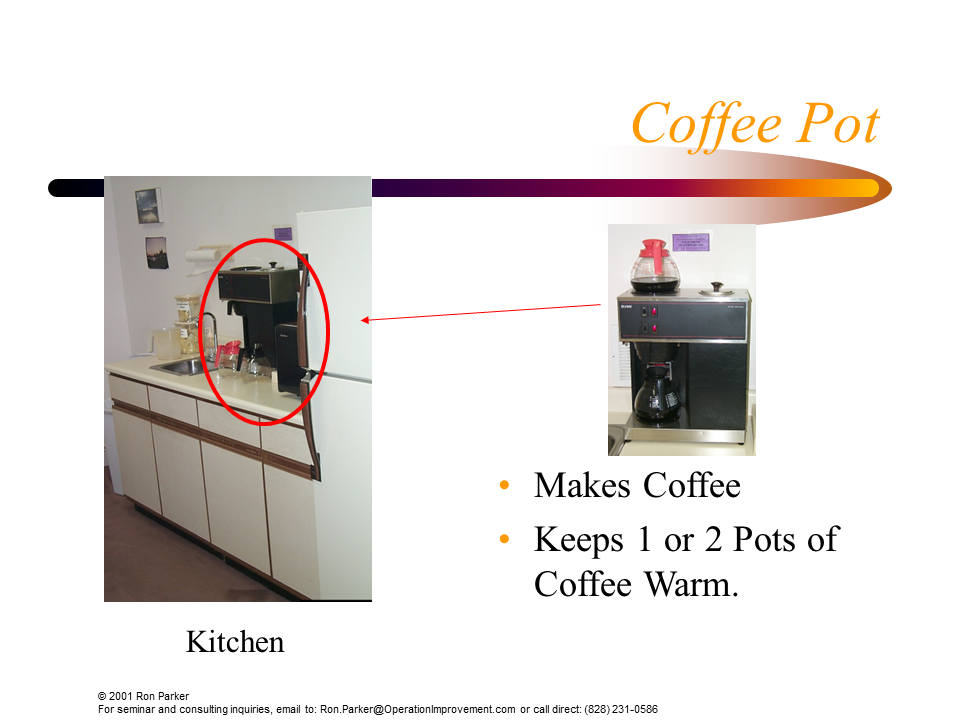
What is It? Where is It? What Does It Do?

How Does It Work?


