Archive
Grok Says: The History of Quality Science
From Grok.com:
“Before Six Sigma, Lean, and the Black Belt concept emerged in the 1980s, several foundational quality management and process improvement methodologies shaped the landscape. These precursors influenced the development of modern quality systems, focusing on defect reduction, efficiency, and statistical control. Here’s a concise overview of what came before, in rough chronological order:
- Statistical Quality Control (SQC) – 1920s–1940s
- Key Figure: Walter A. Shewhart at Bell Laboratories developed SQC in the 1920s, introducing control charts to monitor process variability and distinguish between common and special causes of defects.
- Impact: Shewhart’s work laid the statistical foundation for quality control, emphasizing data-driven decision-making. His Plan-Do-Check-Act (PDCA) cycle, later refined by W. Edwards Deming, became a cornerstone of continuous improvement.
- Context: Used in manufacturing, particularly during World War II, to ensure consistent production quality.
- Total Quality Control (TQC) – 1950s
- Key Figure: Armand V. Feigenbaum introduced TQC in the 1950s, emphasizing quality as a company-wide responsibility, not just a manufacturing function.
- Impact: TQC integrated quality into design, production, and customer service, influencing Japanese industries post-WWII. It introduced the idea that quality impacts costs and customer satisfaction, a precursor to Six Sigma’s customer-focused metrics.
- Context: Adopted widely in Japan, where it evolved into broader quality management practices.
- Japanese Quality Movement (Post-WWII, 1940s–1960s)
- Key Figures: W. Edwards Deming and Joseph M. Juran worked with Japanese companies like Toyota and Sony, introducing statistical methods and quality philosophies. Deming emphasized PDCA and system-wide improvements, while Juran focused on the “quality trilogy” (planning, control, improvement).
- Impact: Japan’s focus on quality circles—small employee groups solving quality issues—improved processes and reduced waste, directly influencing Lean’s emphasis on teamwork and efficiency. The Japanese approach prioritized continuous improvement (Kaizen), a key Lean principle.
- Context: This movement transformed Japan into a global leader in quality, inspiring Western companies to adopt similar practices.
- Toyota Production System (TPS) – 1940s–1970s
- Key Figures: Taiichi Ohno and Eiji Toyoda developed TPS, which became the foundation of Lean manufacturing.
- Impact: TPS focused on eliminating waste (muda), improving flow, and optimizing production through techniques like Just-In-Time (JIT) and Jidoka (automation with human intelligence). It emphasized respect for people and continuous improvement, directly shaping Lean’s core principles.
- Context: TPS made Toyota a benchmark for efficiency, influencing Lean’s spread to the U.S. in the 1980s.
- Quality Circles – 1960s–1970s
- Origin: Popularized in Japan by Kaoru Ishikawa, quality circles involved workers collaborating to identify and solve quality issues.
- Impact: These groups fostered employee involvement and problem-solving, a precursor to the team-based project work in Six Sigma (e.g., Black Belt-led teams). Ishikawa’s cause-and-effect diagrams (fishbone diagrams) are still used in Six Sigma.
- Context: Widely adopted in Japanese industries, later influencing Western quality programs.
- Total Quality Management (TQM) – 1970s–1980s
- Key Figures: Building on TQC, Deming, Juran, and Philip B. Crosby popularized TQM in the U.S. and globally. Crosby’s “zero defects” concept emphasized prevention over inspection.
- Impact: TQM integrated quality into all organizational processes, focusing on customer satisfaction, employee involvement, and continuous improvement. It lacked Six Sigma’s rigorous statistical focus but shared its goal of defect reduction and process optimization.
- Context: TQM was widely adopted by Western companies in the 1980s, including Motorola, which later developed Six Sigma.
How These Led to Six Sigma, Lean, and Black Belts
- Six Sigma (1986): Motorola’s Bill Smith and Mikel Harry built on SQC and TQM, adding rigorous statistical tools (e.g., aiming for 3.4 defects per million opportunities) and a structured methodology (DMAIC). The Black Belt concept, inspired by martial arts, formalized roles for trained experts, drawing from TQM’s focus on leadership and training.
- Lean (1980s–1990s): Lean evolved directly from TPS, popularized in the U.S. by James Womack and Daniel Jones in their book The Machine That Changed the World (1990). It focused on waste elimination and flow, complementing Six Sigma’s defect focus.
- Black Belts: The Black Belt role, introduced by Motorola, was a novel way to professionalize quality roles, inspired by martial arts hierarchies (developed by Jigoro Kano in the 1880s for judo) and built on TQM’s emphasis on trained quality leaders.
These earlier methodologies provided the statistical, cultural, and operational foundations for Six Sigma and Lean, with Black Belts emerging as a structured way to implement these principles. “

Software as a Service
Software as a service is frequently offered with a “free tier” or “freemium” option for testers to evaluate the suitability for use. After that, typical billing is either per seat licensing or “pay per use”. While per-seat agreements are attractive for a fixed and predictable periodic expense, there are a few things to watch for.
1. Seat bundles. Licenses may be offered in bundles of 10, 25 or more.
2. Vendors that don’t publish hard price commitments often want to negotiate a contract commitment or upsell.
3. License renewals may not have a cap on price increases.
4. License management, making sure that every seat is filled, requires oversight.
5. Per seat licensing agreements may not easily scale up or down when demand for the service changes over time.
“Pay for use” services easily scale up or down. This reduces costs when need for the service declines, but the total cost over time may be harder to predict, harder to budget, and may wind up costing more than per seat licenses.
Run the numbers and model scenarios when comparing vendors with different payment models.
Final thought, always identify a primary vendor and a backup plan for cloud-based services. Know how you will route phones, emails, web traffic and where you will host servers just in case.
The largest vendors in the business will obsolete a service when it is no longer a part of their tech road map. (Microsoft SKYPE, Amazon Chime Business Calling, etc.)
The “Elon Musk” DOGE approach
The “Elon Musk” DOGE approach is relying on a couple of rapid improvement secrets that we have used for years.
Here’s a big one: Don’t trust the existing “as-is” reporting. Begin with independent, direct, read-only access to the source databases relevant to the scope of work.
Actionable information is frequently hidden in the roll-up of raw data to dashboard summaries. Be prepared to rebuild fresh management views of the operation.
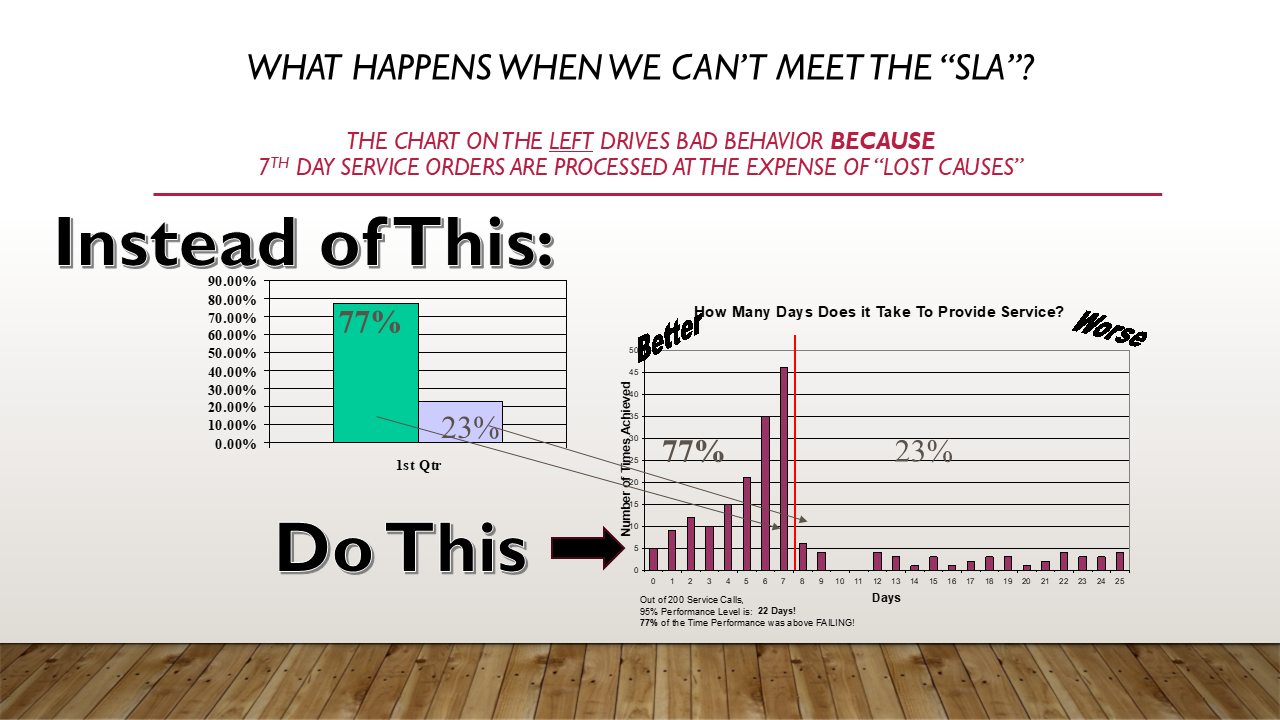
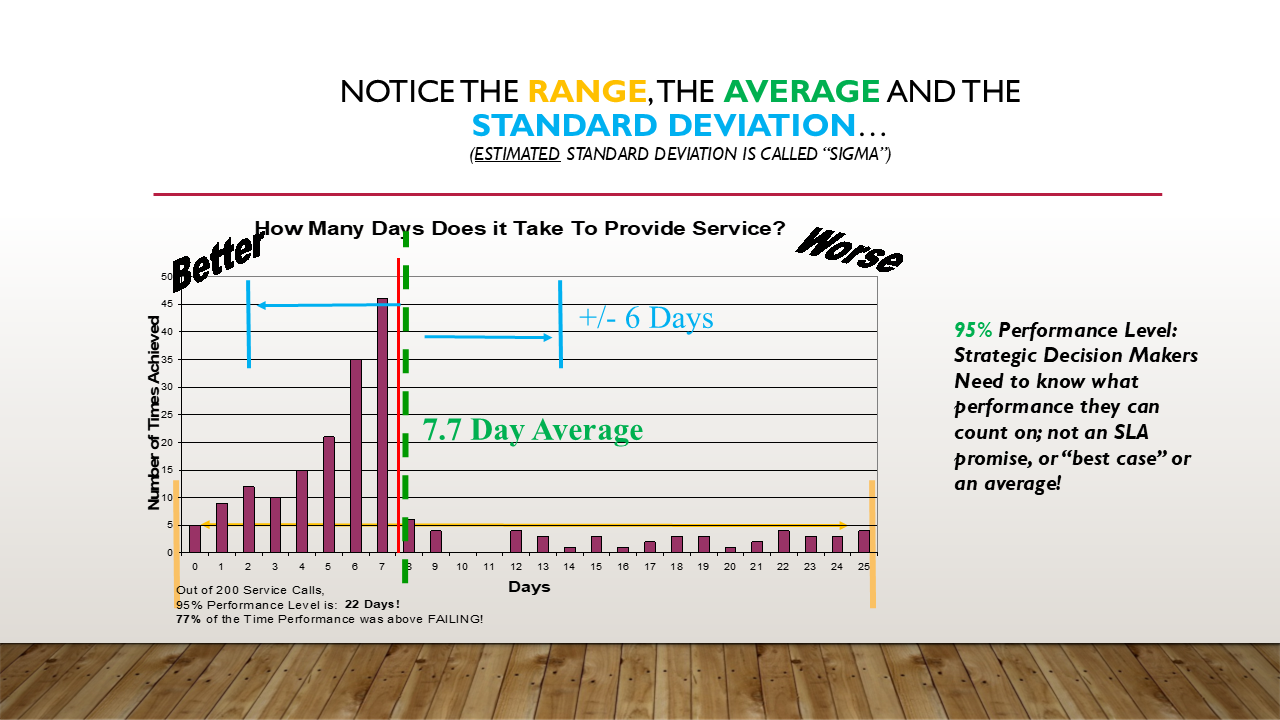
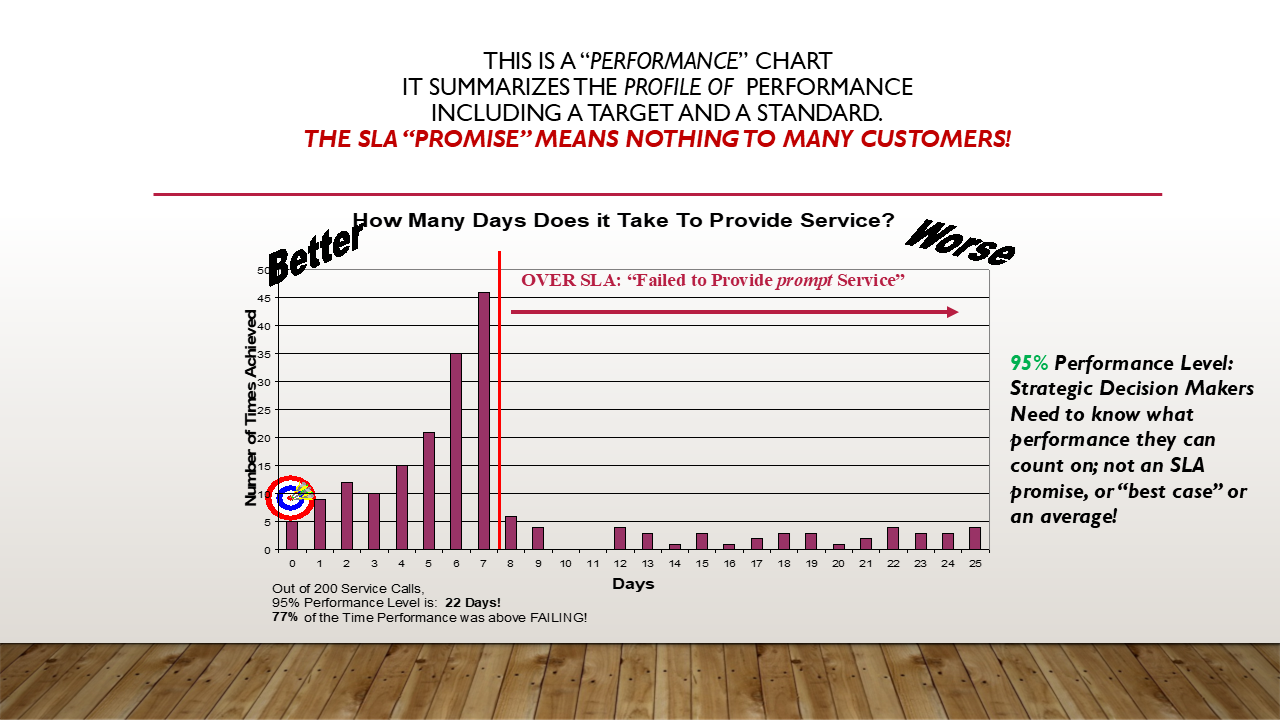
We have often seen well-intended and wrong “KPIs/SLAs/MBOs” where better scores track with worse results. Incentivizing wrong behavior means that greater effort may result in better numbers on the scoreboard while simultaneously producing worse outcomes.
To get an improvement initiative started in manufacturing: start with raw process and product data, quality and warranty returns, production and scheduling, and process flows. Go out into the operation and observe/collect any missing data manually (sampling judiciously) if necessary.
To get started in a service business: tap directly into the historical and real-time phone and CRM databases and any resource systems agents and front-line workers use to support clients. Listen to calls in the call center.
Observe the “as-is” to see how past problems and workarounds have created less-than-optimum business processes. (There is always a reason that people do the things they do in an operation. Find both real and imagined reasons for why things “are the way they are”.)
Then, work with small teams of front-line workers, supervisors and managers. Start with a blank sheet – then build and test a new process to stream in when it’s ready to replace the legacy.
Ad-hoc teams formed from resources present in the existing operation have always kept our consulting footprint small. This approach generated enthusiasm for change and created a “base camp” in the organization to promote learning, teaching, sharing and improvement.
Got Two Minutes?