Archive
The “Grouping Error”
Observations can be turned into data by measurement. Measurements can be summarized by statistical analysis, and then decision-making ideas start to emerge from the numbers.
But wait! there is this thing called “the grouping error”.
Here is our classic “classroom” story illustrating this problem:
Ten machines are “bubble-packing a consumer product and a statistical summary concludes that about 1% of the packages are mangled, damaged – crushed in the packaging machines. It’s appears to be an alignment failure of conveyor, product and heat-sealing stamp/press.
This idea begins to emerge. What do these ten machines have in common that causes an occasional alignment failure? Is it a Timing mechanism? Are there plastic parts that should be replaced with steel? Do we need to rebuild/replace these machines with precision stepping motor components? (Don’t raid the capital expenditure budget yet!)
Here is how the 1% came to be: ONE machine had a 10% scrap rate and the remaining nine had little or none. A DIFFERENT IDEA emerges from the numbers: what is different about machine number ten?!!
I have seen this exact issue in more than one industry/process, and of course there are ways to be vigilant and catch this mistake before the final roll-up of data into a final report.
A data analyst might know that a histogram can show multiple peaks (“bimodal”) indicating that a single average does not describe the population. A statistician might look at data clusters or perform a F-test or test for a goodness of fit to a normal distribution. Any of these checks and more could be employed to examine suspicious data for a grouping error.
However, there are the facts we know from simply observing the thing we measure. CNC machining data should probably not be merged too early in the analysis with “old school” machining technology or additive manufacturing. Defective/damaged products manufactured from wood should be studied apart from same products made from metal . Call center calls with translators should not be prematurely grouped with calls handled by native speakers.
Working with data does NOT mean shutting out every other fact and observation available to us, and this other information guides us as we extract the right conclusions from the data we collect.
“We Tried TQM, Lean, Just In Time, Six Sigma, etc…but”
Follow us on “X” (Twitter)
A helpful post contrasting the definitions of Lean versus Six Sigma made me think about the skeptical reaction many have when the latest improvement buzz phrase or acronym appears in media. There are always successful and credible case studies, but many are left thinking that surely a key ingredient has been left out of the tasty recipe.
The “Silver Bullet”
For years, we attributed this to the wish for a “silver bullet”, a quick solution to that performance, time, cost or risk problem. Perhaps the way solutions are presented (Six Sigma versus lean versus Kanban versus KPIs versus dashboards, team building, etc.) contributes to the misunderstanding and misuse.
Maybe it is the way that older strategies are renamed, rebranded, and upgraded with larger and larger data requirements. If SPC didn’t work, then maybe DOE, regression (sorry: “Predictive Model Building”), multiple regression, data lakes, simulations, linear algebra and AI are the answer.
Certainly, greater computational power, technology improvements and more data is a positive; but these various methods and tools should not be treated as “siloed” solutions. There is often a missing ingredient in many approaches, and that is integration of these tools with each other and with a conceptual view of the processes one wishes to improve.
Quality, Performance & Value
Many struggled with TQM (“Total Quality Management”) because of the tendency to conflate “Quality” with “Performance”. To clarify this I would ask teams, “What would Total COST Management represent? What is the value of an absolutely perfect wedding cake one day late?” When they came to see quality as value to the customer, TQM began to be integrated with the famous conceptual formula from Project Management: “Value=FunctionOf(Performance, Time, Cost, Risk)” (Not every chicken dinner needs to be a $1000/plate celebrity chef masterpiece to have value.)
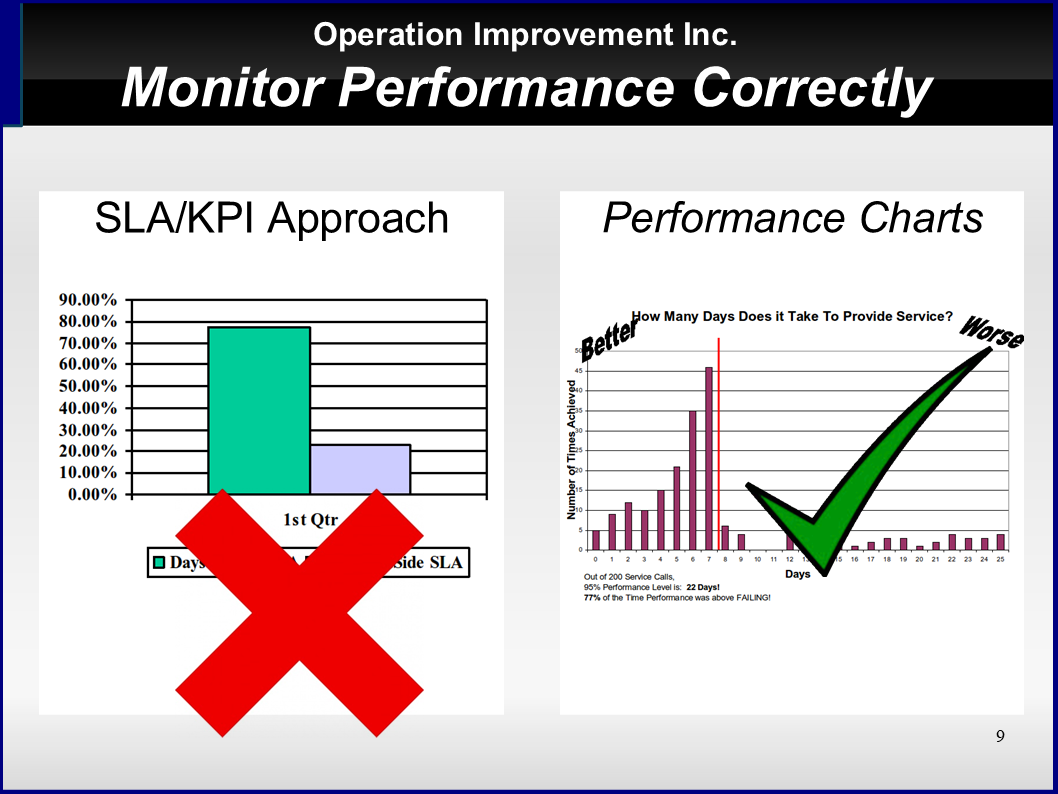
When high scoring “Quality as Value” KPIs do not tell us that customers were disappointed – we must add the knowledge that metrics and measures are not the same; that actionable descriptive statistics will rely on homogeneous groups and that outliers and trends can hide in a statistical analysis that ignores time sequence and variability.
Variability & Outliers
When descriptive statistics is integrated with probability functions and Statistical Process Control (SPC), we began to get a near real-time picture of variability, quick recognition of outliers and objective evidence of homogeneous groups for acceptance testing – We then need to integrate this with an action plan for outliers. We need tools to connect causes (“Things and how they behave”) with effects (changes in variability and outliers.)
Visualizing Process Dependencies
When Cause/Effect or “dependency” diagrams give us visual relationships between “What we do” and “What we get”, we become able to integrate this with our metrics, measures, process and product targets and data collection strategies. With this additional tool, we can integrate team building, leadership exercises, sustainment training and “learn, share, teach, improve” training with experiment days.
The “Base Camp”
When we finally have what we call, a “base camp” from which further improvement can occur; then we are ready to try and test advanced optimization techniques, large data set tools, technology upgrades and more.
Whether our improvement initiatives began with process inputs, customer deliverables, a bottleneck process or in quality, lab and measurement; we continue to integrate – to connect what we know and have learned about one area to others and we may use one of the various “value chain” techniques.
Continuous Improvement
We match inputs of one internal process to the outputs of another to optimize and align. As variability is reduced, buffer stocks can be gradually reduced and Just-In-Time techniques can be incorporated.
There are other tools in the process improvement toolbox, some of which are optimized for manufacturing and some for the service industry. The principle is the same. Regardless of which techniques come first and where in the process we begin, there is need for integration into an expanding process knowledge database structured to support -human- intelligence and conceptual understanding of work and deliverables.
Actionable Metrics
An analysis, dashboard, diagram or computer output that has not been integrated into the sum of what we know is -not- actionable. If you have seen daily, weekly, and monthly status report on paper or screen that do not drive action, you know exactly what I mean. It’s the Monday morning “Read and File” process, and that may be why these approaches sometimes fail.
Actionable Data
It seems like everyone is talking about “Data” and “Data Analysis”. Of course, what everyone wants is actionable data!
A “play it where it lies” approach to data simply treats any data as a math problem. There are just numbers to be crunched and fed into statistical algorithms with only a loose reminder of their connection to the real world. We then have results and answers without conviction – UNactionable data.
Actionable data always has an explicit logical chain of thought beginning with first-hand observation of something. Then we sharpen our observations with attribute or variable measurement by making a systematic comparison to an objective standard. (We count and quantify.)
With physical characteristics this is often straightforward, but do we all agree on the objective definition of: a NEW customer? an EXCELLENT customer service call? full COMPLIANCE to policy or contract deliverables? a DEFECTIVE part? an IMPROVED process? an OUTAGE in our IT systems?
With even the best measurement system in place, we still have two recurring measurement quality issues: outliers and missing data. Have we investigated outliers as opportunities to learn and integrate new information or do we pretend that they don’t exist? And, what about missing data? Some missing data can be interpolated, but other missing data should also be treated as outlier information.
GPS position and location tracking data might be used to extrapolate an in-between location and time, but missing refrigerator temperature data might indicate an equipment malfunction or failure!
If, without grouping errors*, we correctly begin to reduce good data with descriptive statistics; then human ideas/abstractions will emerge from the numbers. We begin to confidently speak and accurately describe the typical “new customer”, “service call”, “warranty return” and so on; and we can graphically illustrate the analytical results that back up these sweeping generalizations.
Our confidence in these conclusions rests on our ability to trace all the way back to what could be seen, heard and experienced, and that is what makes this data actionable.
Changing How We Think About Work
There are many excellent points in this Linkedin” slide presentation, and I especially like the arrangement across time of these popular methods.
(See/Search: “Continuous improvement, encompassing Lean, Kaizen, and Agile methodologies, advocates ongoing excellence through gradual refinement….” on LinkedIn)
There are three things that I would add from my experience.
First, there is a tendency to equate quality with performance. Quality is value as seen by the customer. I have made this distinction in other articles and there are several ways to see this.
a. The project management connection: value = function(performance, time, cost, risk). That integrates understanding of project management and process management as the two basic skills of “tactical management”. (Management of -available- means to an end.)
b. There is the relationship of “performance”, “specs”, and “targets” to sales and marketing. “People don’t want to buy a quarter-inch drill. They want a quarter-inch hole!” –https://quoteinvestigator.com/2019/03/23/drill/
c. The measure is not the metric. Space inside cardboard box can be measured by length, width, depth, cubic inches. Or one can count the number of unbroken cookies that will fit securely in the box. (“Cookies or crumbles?”
Second, these various “schools” of quality are just that. They are different approaches to teaching the same/similar mental skills like: experimentation, basic measurement and statistics, cause/effect thinking, organizing and planning, conceptualizing and then drilling down to details, etc.
If one teaches root cause analysis with fishbone, 8 steps, 5 whys, deductive logic, or Aristotelian causality – the end skill is the ability to trace a causal chain back to choices one could have made and can make in the future.
Finally, when strategic decision makers provide new facilities, new tools, and new processes, performance expectations go up.
For tacticians, the driver of performance improvement is new knowledge about the existing facility. Experimentation techniques are “hunting” for the causes that keep us from hitting the target every time. Control chart techniques are patiently “fishing” for causes. In a sea of countless tiny independent causes of variation, we watch and wait for a cause that surfaces above the noise. That “out of control outlier” tells us when and where to look and learn, share, teach and improve.
We naturally expect that large capital outlays and clever engineering should result in better product performance. What one hundred years of these quality management tools teach us is that changing how we think about work can result in just as big an improvement.
Got Two Minutes?